|
The SPIRIT Project Educational Robotics Lesson Building Block Template Author: ____Peggy Madsen_____________ Grade Level: __8_ Date: __July 20, 2006_ |
Directions: Definition of a Lesson Building Block: This is a "Lesson Building Block" from the SPIRIT educational robotics institute. A 'lesson building block' is in essence an educational activity that might be later turned into a more formal classroom lesson by a creative teacher. The SPIRIT Institute is striving to put a variety of "lesson building blocks" up on the web for the potential use of teachers as they try to prepare more formal educational lessons using the TekBot robotics platform.
I. Concepts (Give a list of one or more concepts that might be taught using this activity)
Graphing Coordinates on Coordinate Plane
II. Standards
(Give a list of one or two local, state or national standards that appear to apply)
OPS Math 8/Pre-Algebra Standard #4 Graph Coordinates and Linear Equations on a Coordinate Plane
III. Learning Activity Context (Describe the overall context for the learning activity)
Context: X__ Moving TekBot __ Building a TekBot _X_ Engineering / Notebook __ Other
Abstract: (Give a 1 paragraph abstract of the activity)
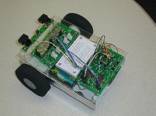
Students will use a completed Tekbot to fulfill the requirements of this lesson. The Tekbot will run up several types of ramps at maximum speed. Time and distance covered will be documented and analyzed. Once the trials have been completed, the data results will be graphed on a coordinate plane.
IV. Teacher and Student Suggestions/Tips
(Provide some general tips or suggestions for trying the activity)
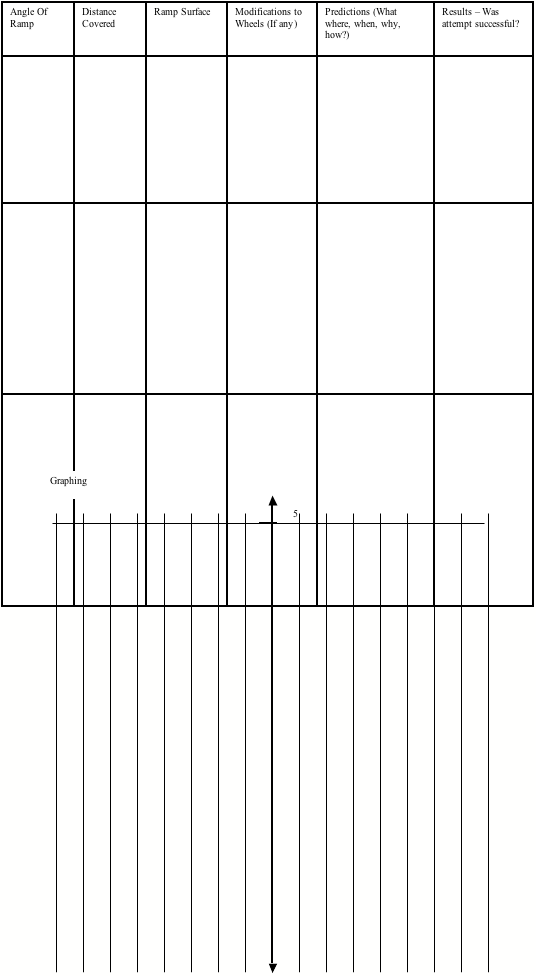
Ramps will be covered with "artificial grass" type carpet, indoor/outdoor carpet and one will be left plain wood. Wheels on TekBot can also be modified to produce additional results for graphing. Modifications to wheels can include covering the wheel with a strip of plastic wrap to lessen friction, a stair tread strip or strip of sand paper to increase friction, rubber bands to increase traction or a long balloon fastened around the wheel to more closely resemble a rubber tire. Using the formula rate X time = distance (r*t = d) is an excellent way for students to begin learning how to graph a one variable equation as well. This exercise is introductory to graphing, however and the equation exercise could be used as an entirely separate lesson, if desired.
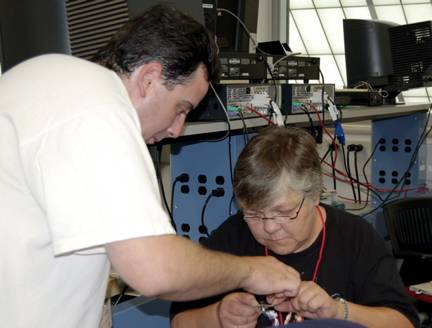
If students have not already built a Tekbot of their own to use, one will be provided for the testing.
V. Teacher Questions
(Give a list of questions that teachers might ask students during the activity)
- What happens when you change the angle of the ramps?
- What difference did the surface of the ramp make?
- What happened when you modified the wheels?
- How might this type of information be used when engineers design new automobiles or new tires?
- If you were to design an automobile today, what would this information do for you in the decision making process?
- Is there a correlation between ramp surface and speed? What about wheel modifications and ramp surface variations and speed?
- Did all of the variations allow the Tekbot to complete each run? Why or Why not? Give some theories as to the how and why the results are so varied.
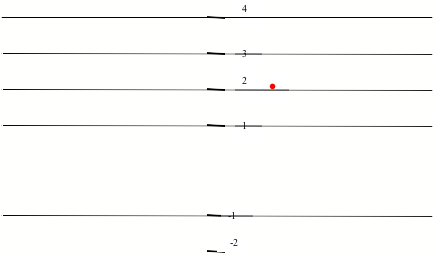
- Could we have negative values on our graphs and in the resulting data? Explain why or why not.
- What if we changed the angle of the ramp (other than those we tested), could we make a prediction as to what would happen and provide adequate data to support this assumption?
- Did your data produce a straight line on your graph or what type of line resulted from the graphed data?
- Are the results what you predicted? If not, speculate why the results were different. If the results were as predicted, write the justification for your predictions and correlate this justification with your results.
VI. Assessment Ideas
(Give an idea or two about how the lesson activity might be assessed)
Rubric grading recommended. Could be assessed by evaluating each graph to insure that the testing was complete and results documented accurately. Graphs with prominent variances should be analyzed to determine the cause(s) of these variances.
VII. Other Information
(Give any other information that might be useful or a visual or two)
Ramps should be at least 2 feet long, preferably 3 feet. Mark off 1 foot toward the middle of the ramp to provide a constant in the equation r X t = d. This will also enable students to fill in the time factor and solve for the rate.
Materials:
Completed Tekbot
3 Ramps with varying surfaces
Stopwatch/timer
Rubber bands
Balloons
Plastic Wrap
Sand paper/Stair tread
Pencil/Pen
Notebook
Data Documentation Sheet
Rubric (If using for assessments)
Graph paper
Ruler
Data Documentation
|
|
|
|
|
|
|
|
|
|
|
|
|
|
|
|
|
|
|
|
|
|